MSA REPORTS: Forecasts
[Updated January 1997 - UAB]
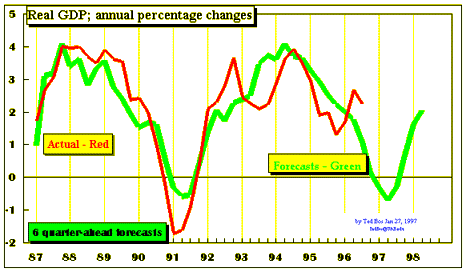
On the basis of a self-made forecasting mechanism, business economics professor Bos of the University of Alabama predicts a continuing tendency for the economy to go into 1991 type recession. This recession could start in 1997. The changes made in the GDP deflator in 1995, have made real GDP somewhat more erratic than before. Note that the changes in real GDP plotted below, are annual changes, not quarterly ones as provided in the media. See the forecasts for the other series below for corroborating evidence.

Click here to see the data!
Forecasts for Other Series
Employment
Industrial Production
Retail Sales
Unemployment Rate
Unemployment Rate Charts: Smoothed and Actual: Selected States:
Forecasts for both
real GDP and
U.S. unemployment rate
show movement towards a recession in
1996. Because the U.S. unemployment rate is nothing more than a weighted average of the
individual State unemployment rates, and if
a recession is on its way, then several States should already be showing signs of recessionary pressure.
State unemployment fluctuates a little too much to rely on monthly data, so the unemployment rate charts shown
are smoothed by a centered 12x2 moving average (This knocks out both seasonal and random fluctuations).
This transformation of the data "loses" the last six months.
This is the price we pay for the monthly fluctuations (which include both seasonal and random variation).
In any case we see that the unemployment rate for several selected States is already increasing -
Illinois,
Kentucky,
Maryland,
New Mexico,
North Carolina,
Ohio,
Pennsylvania,
Tennessee, and
see the actual data files for the unemployment rates, click
here.
Employment Growth Charts: by Sector
Similar to the above exercise with State unemployment, if the economy is going into a recession,
then some employment sectors should already be showing signs of recessionary pressure.
Employment in only two "2-digit" industries are in recession right now -
Mining, and
Manufacturing
- though Mining has been sick for some time.
As with the State unemployment data, the calculation of annual percentage changes
"loses" half a year of data.
Leading Economic Indicators: Smoothed Growth
This page provides access to current charts of smoothed growth of the LEI (the composite index of the 11 leading economic indicators), and for each of the 11 component series.
Home Sales by Region: New and Existing Homes: Smoothed Growth Charts
- US:
- Midwest:
- Northeast:
- South:
- West:
Click here
to see a graph of real retail sales growth. On that graph one
sees evidence that retail sales growth has declined. Although
retail sales growth is more volatile than that of real GDP, the
slow-down of retail sales growth is a harbinger of a slowed growth
in real GDP.
Click here
to see how the Purchasing Managers' Production Index is going.
Click here
to see a graph of stock price pressure for U.S.A., Germany, and
Japan.

